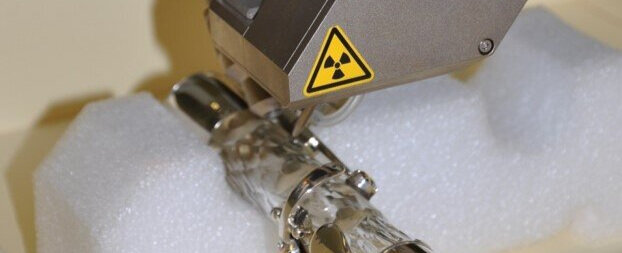
Non-invasive XRF of Claude Laurent DCM 378, Library of Congress.
tools for glass analysis
Light microscopy

Library of Congress colleagues Carol Lynn Ward-Bamford (left) and Lynn Brostoff (right) take photomicrographs of a Laurent Flute in LC’s Flute Vault
Light microscopy---using normal light and magnification ≥ 10x, is extremely useful for diagnosis of glass condition and photodocumentation. Glass can, however, be difficult to examine with a microscope due to light reflections, so that a light source that can be manipulated at different angles should be part of the set-up. In this study, we have utilized and compared methods for visualizing glass objects at different magnifications and set-ups:
1) A Zeiss stereomicroscope (STEMI) outfitted with a camera and accompanying digital image software, using both overhead and raking light illumination at magnifications from ~10-65x.
2) A Zeiss Axio microscope, operated in reflectance mode and using both white light and ultraviolet (UV) light produced from a mercury arc lamp (355 nm). This instrument is used only for examination of small model glass samples that fit onto the stage, and images were acquired with the integrated camera and software at 50-500x magnification.
3) A Nikon D90 digital SLR camera, outfitted with a Nikkor 55-200 mm lens and a Nikon 10x Plan achromat objective (working distance = 7 mm). The camera can be either mounted to a tripod or copystand. This camera adaption is a relatively low cost method for obtaining 10x magnification with photodocumentation.
4) A smartphone with an inexpensive clip-on 10x lens. The phone camera is used with the highest resolution picture setting and held about 0-2 cm above the object.

Surface cracking pattern on an exterior surface ridge of Laurent Flute DCM 475 upper body joint (Library of Congress)
visual vocabulary
We have developed a visual vocabulary to accompany documentation of glass objects. The terminology proposed here is meant to aid conservators and curators describe deterioration and surface phenomena observed in glass objects in an objective manner that can be readily understood by anyone.
To see the Visual Vocabulary, click here.
To take a short survey to help us better our terminology, click here.
texture analysis
We are developing a tool to analyze photographs of glass surfaces using an algorithm that identifies features such as surface particulates and cracking, and characterizes them in terms of quantifiable surface density, light scattering, and network crack angles. The software is meant to be used on uploaded images that can then be characterized according to degree of deterioration.
A glass deterioration “test” is presented on this site that will help us validate this method. In order to contribute to the development of this tool, we invite you take this short image survey, in which you are asked which of two images displays more deterioration. The test will take about five minutes. To help us with our texture analysis tool, click here.

Surface of model flute sample F75 (potash glass) after seven days of artificial accelerated aging at 90 °C and 90% RH photographed with Zeiss stereomicroscope (STEMI) in raking light at 10x magnification.
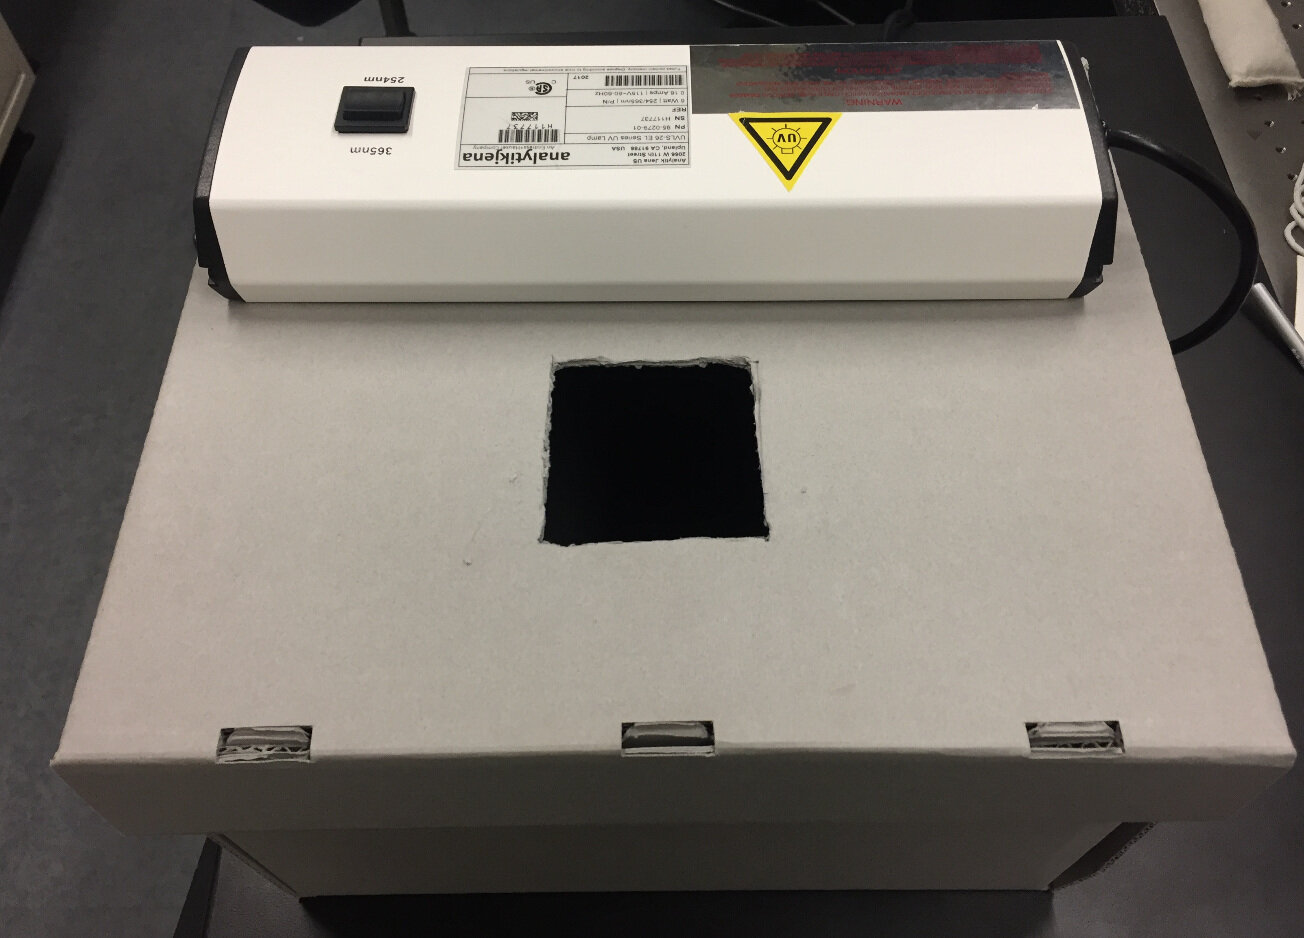
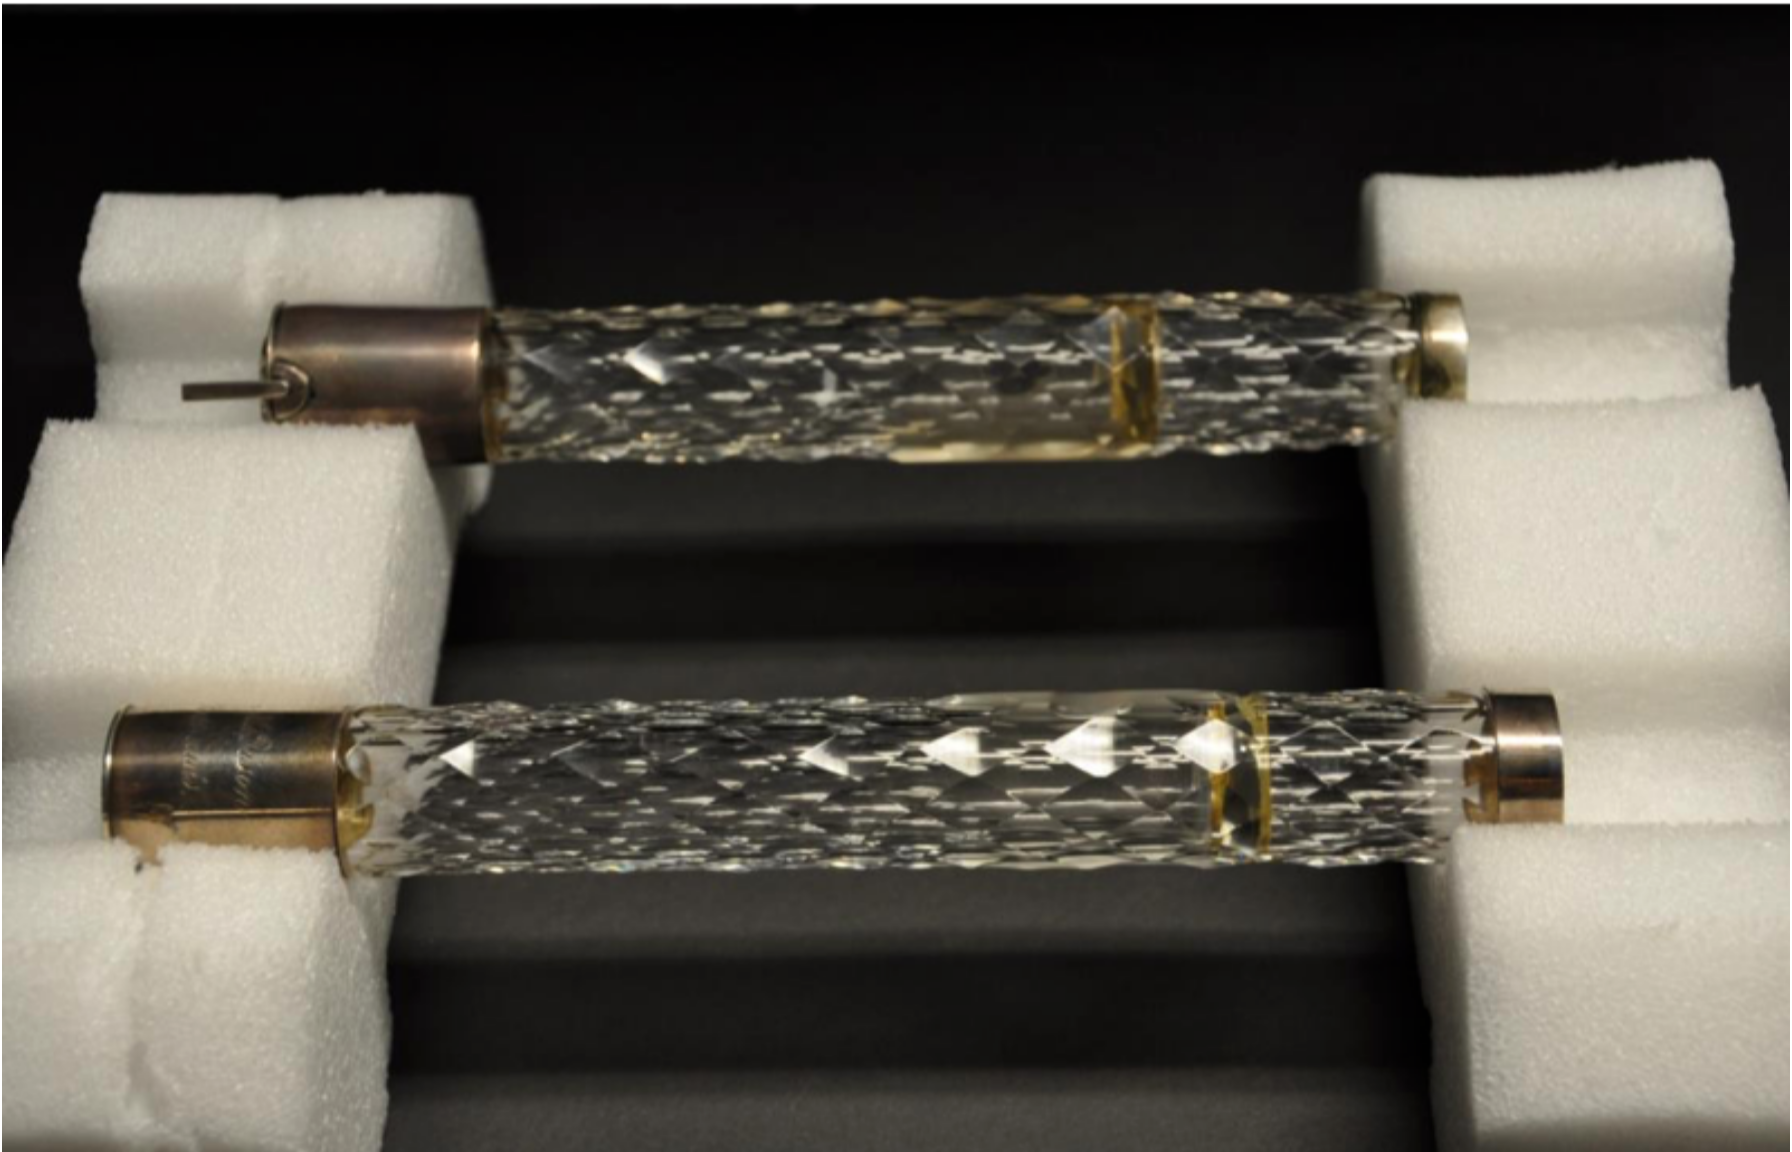
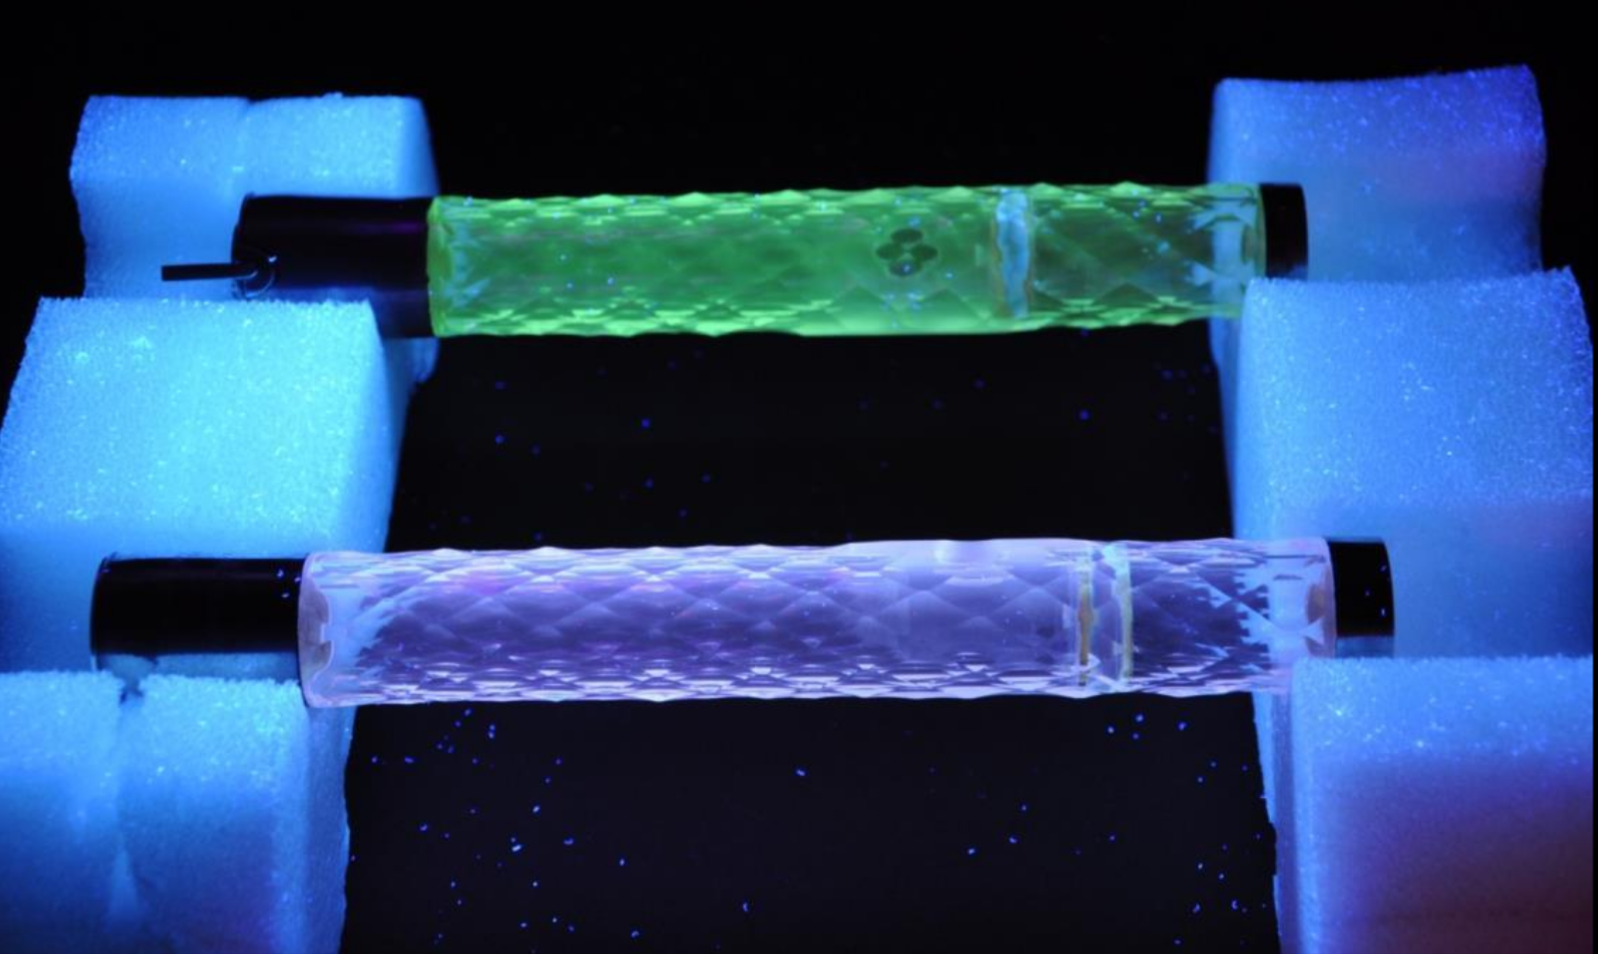
uv examination
Visible fluorescence of glass, produced by illumination with either UVA light (~365 nm) or UVC light (~254 nm), is a well-known phenomenon. When the absorbed radiation in the UV region of the spectrum causes emission of light at a lower energy in the visible region of the spectrum, fluorescence is said to occur. The visible color of fluorescence corresponds to the wavelength of the emitted light. Visible fluorescence in glass usually occurs when specific impurities known as “activators” are present within the silicate network. These activators are typically cations of metals such as lead (Pb), manganese (Mn), or antimony (Sb). In the case of Laurent’s glass flutes, his typical glass formulations contain either Pb or Mn, but no Sb. This phenomenon therefore presents a simple and reliable method for distinguishing the two types of glass in Laurent flutes.
Surface ph

Jr. Fellow Oliva Brum conducting pH testing of Laurent flutes using simple pH test strips (Fisher Scientific).
pH measurement of the surface of historical glass is a routine method of determining the presence of a surface film containing alkali ions, which cause pH to rise above 7 (neutral). Values of pH 8 or more are “red flags” that the glass may not be stable due to alkali leaching. Values of pH greater than 9 may indicate that deterioration mechanisms also involve hydrolysis of the silicate network. Surface pH measurements in this study were obtained using colorpHast pH paper strips (Fisher Scientific) with ranges of pH 5-10 and 7.5-14. The strips were sufficiently wet with deionized water and lightly pressed on the glass surface for two minutes. This method appeared about equivalent to applying controlled droplets of deionized water on the glass surface before pressing with the pH strip. The method is difficult to standardize and can often yield confusing results on historical glass, so that more development is necessary to make pH measurement on glass completely reliable. However, measurement of pH greater than 8 should be taken as a warning sign.
x-ray fluorescence

Laurent flute DCM 378 undergoing analysis with non-invasive XRF using a Bruker Artax 400.
X-ray fluorescence (XRF) utilizes X-rays non-invasively to detect the elemental composition of materials. This common analytical technique is based on the interaction of X-rays and atoms in the material in a phenomenon known as fluorescence, in which characteristic X-rays that divulge the identity of elements present in the material are emitted. Three XRF instruments were utilized in this study to determine the elemental composition of glass flutes, historical photographic glass, and model glass samples: 1) a portable Bruker Tracer 5i XRF utilized with He purging and positioned on a tripod (Library of Congress); 2) a Bruker Artax 400 XRF outfitted with micro-optics and He purging (Library of Congress); and 3) a Malvern PANalytical instrument (Vitreous State Laboratory). Results from XRF are here interpreted qualitatively, semi-quantitatively and quantitatively, depending on the instrument and the object, through the use of standard glass reference materials.
Fiber-optic reflectance spectroscopy

FORS analysis of Laurent Flute using a ASD FieldSpec 4 Hi-Res: High Resolution Spectroradiometer in reflectance with a 45 ° angle configuration.
Fiber-optic reflectance spectroscopy (FORS) is a non-invasive, non-contact analytical technique that utilizes light that spans the visible, short wave and near infrared light spectrum. With the instrument shown here, light ranging from about 400 – 2500 nm is reflected off the glass surface. The detector then determines when vibrational interactions occurs, producing spectra that show absorbance peaks that provide information about material. In the case of alkali silicate glass, hydration layers can be detected by FORS through detection of absorbance peaks related to the presence of water.
optical coherence tomography

Lynn Brostoff looking at a 3D surface rendering of OCT analysis of a Laurent Flute (Library of Congress)
Optical coherence tomography (OCT) is a non-invasive, non-contact imaging method that utilizes near infrared light and the technique of interferometry to determine the depth from which optical reflection occurs in a material. Both two-dimensional and three-dimensional images that describe optically-scattering sites may be reconstructed by scanning across and into a material. This is a standard technique in the medical field, but relatively new in the field of cultural heritage. Applied to glass, which is quite transparent to near infrared light and highly scattering, OCT analysis is capable of revealing cracking and delamination beneath the surface at depths greater than one millimeter, depending on the clarity of the glass. OCT is also useful for measuring hydration layers that form on deteriorated glass above about 10 micrometers.

Carol Lynn Ward-Bamford positioning a Laurent flute for examination by computer tomography (CT) at George Washington University Hospital.
computerized tomography
Computerized tomography (CT) measures X-ray interactions at different angles, creating cross-sectional maps that are combined a three-dimensional rendering. CT is a standard non-invasive medical imaging technique and was used in the technical analyses of two Laurent flutes to visualize and accurately measure the flutes in cross-section, and thus gain insight into how the flutes were manufactured.

Fr. Andrew Buechele sampling a Laurent flute for examination by SEM/EDS.
scanning electron microscopy/energy dispersive spectroscopy
Scanning electron microscopy (SEM) with simultaneous energy dispersive spectroscopy (EDS) analysis is used to characterize the microstructure and composition of materials simultaneously. Electron microscopes can view objects at much higher magnifications than optical microscopes. It’s downside is that it is destructive, and requires a small sample to be removed from an object. SEM creates images not by using light, but by an electron beam. The electron beam is rastered across an area, interacting with the material and causing electrons to be ejected from the material’s structure. Detectors in the microscope measure how many electrons are ejected and use it to construct an image.
EDS, like SEM, uses the electron beam to interact with the sample material. However, EDS measures the energy of x-rays that are emitted from the sample material and how many x-rays are emitted. The x-rays are emitted at energies specific to the material they came from. Therefore, EDS can gather compositional information from the sample.
raman spectroscopy

Renishaw inVia Raman microscope.
Raman spectroscopy utilizes lasers at specific wavelengths, normally in the infrared spectrum, to excite molecular vibrations in materials. Similar to FORS and other forms of vibrational spectroscopy, molecular vibrations are produced that are detected in the scattered light as absorbance, i.e., a change in the energy of the light, producing a spectrum with peaks. The Raman spectra of many materials are known, allowing material identification. In this study, Raman spectroscopy was used as a complement to XRD to identify surface particulates in microsamples taken from glass surfaces. Raman spectroscopy was also used non-invasively to analyze accretions on the model glass samples.

Rigaku X-ray diffractometer.
x-ray diffraction
X-ray diffraction (XRD) is based on the phenomenon of diffraction of X-rays by the regular planes described by the atomic structure of a crystalline material. Amorphous materials like glass do not have regular arrangements of atoms, and therefore do not diffract X-rays in discreet patterns. In this study, XRD was used to identify surface particulates in microsamples taken from glass surfaces.